A student presenting a solution to a school scheduling problem opens with her recommendation on slide one and spends the remaining eight slides justifying it. Her classmates follow the logic. What they cannot evaluate is whether she considered alternatives, tested her assumptions, or understood the constraints she was working within. The answer is on the slides. The thinking is not.
The problem-solving presentation is different from the persuasive presentation in one critical way: the goal is not to convince an audience to adopt a predetermined conclusion. The goal is to show an audience how a problem was analyzed, what options were considered, and how a recommendation was reached. The quality of the thinking is the product. Students who treat problem-solving presentations as persuasive presentations are showing the audience where they ended up, not how they got there.
What a Problem-Solving Presentation Is Designed to Do
A problem-solving presentation has two jobs: demonstrate rigorous analysis and defend a recommendation that emerges from that analysis. Both matter. A recommendation without visible analysis is an assertion. Analysis without a clear recommendation is an academic exercise. The combination — structured problem definition, transparent criteria, evaluated options, and a defended recommendation — is what the presentation is designed to produce.
This format appears across disciplines: case study presentations in business courses, design challenge presentations in engineering, policy proposal presentations in social studies, and diagnostic presentations in science. The structure is the same regardless of content. Students who learn the structure in one context can apply it in any other.
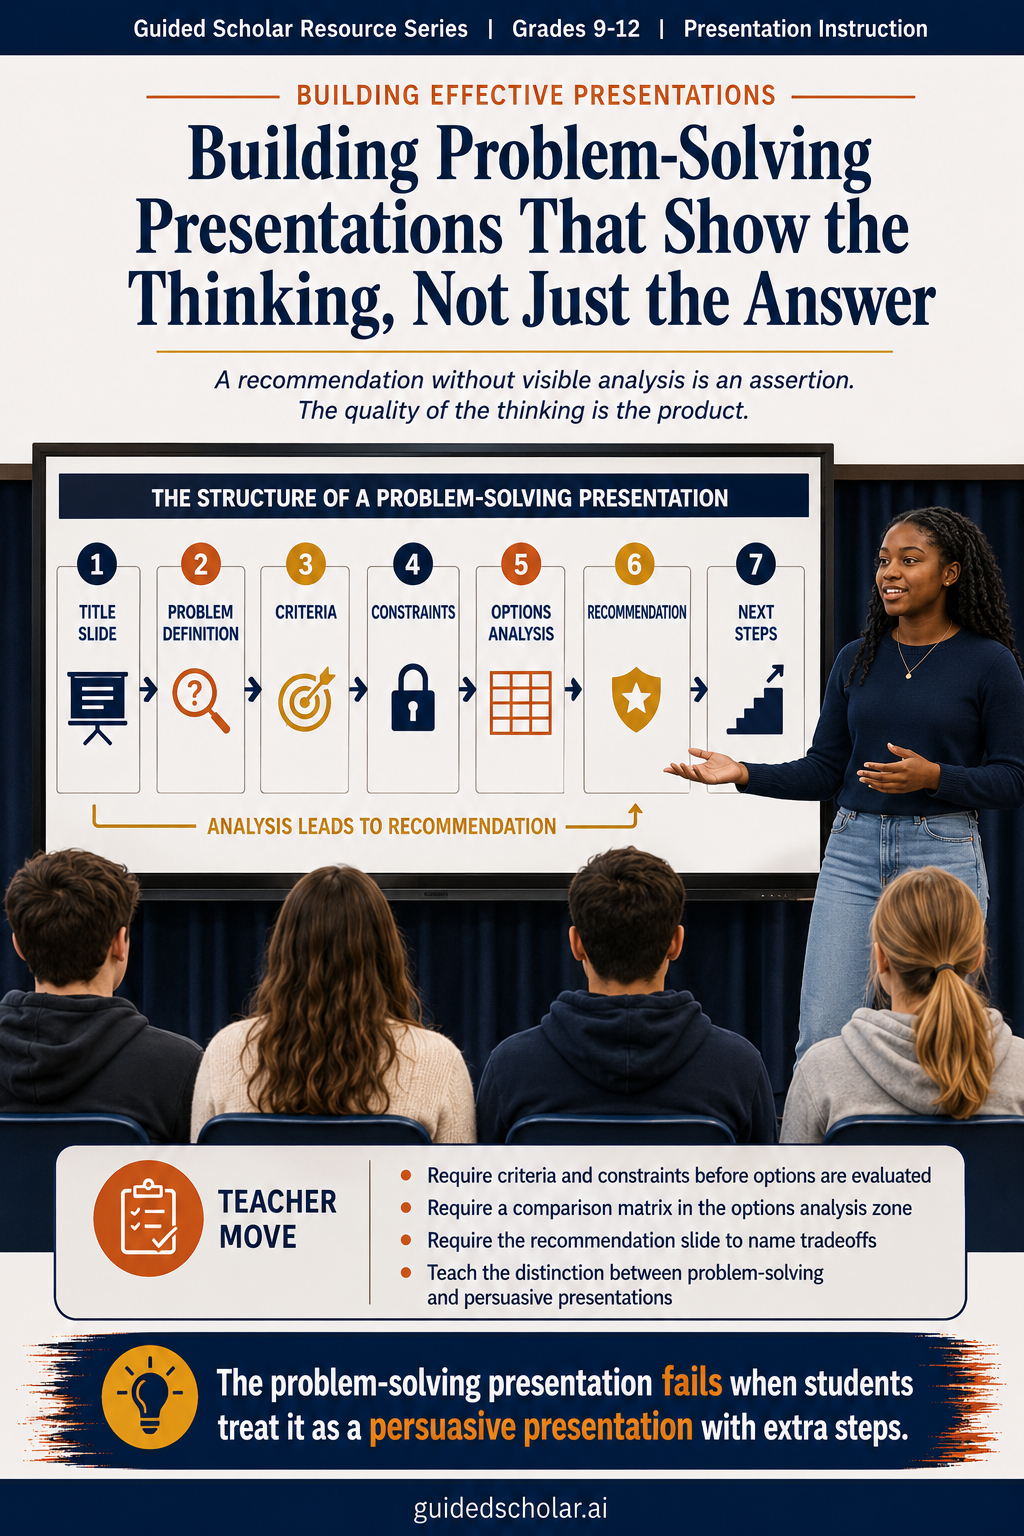
The Architecture of a Problem-Solving Slide Deck
A problem-solving presentation follows a five-zone structure: problem definition, criteria and constraints, options analysis, recommendation, and implementation or next steps. Each zone has a specific job and the zones must appear in sequence. Presenting the recommendation before the criteria and constraints have been established is the most common structural error, and it undermines the credibility of the recommendation regardless of how sound it is.
Defining the Problem: The Foundation Zone
The problem definition zone is the zone most student presentations either rush through or skip. A one-sentence problem statement on the title slide is not a problem definition. A problem definition establishes the current state, the desired state, and the gap between them. It names who is affected, to what extent, and why the problem has not already been solved.
Students who cannot write a precise problem definition are not ready to propose a solution. A vague problem definition produces a vague solution because the criteria for evaluating options have not been established. “The school schedule is inefficient” is not a problem definition. “The current seven-period schedule creates lunch periods shorter than 20 minutes for 60% of students, which the district’s own nutritional guidelines identify as inadequate” is a problem definition that makes the criteria visible.
Criteria and Constraints: The Evaluation Framework
The criteria and constraints zone is the element that distinguishes rigorous problem-solving from preference-driven recommendation. Criteria are the standards the solution must meet. Constraints are the conditions the solution must work within. Both must be established before options are evaluated.
A criteria slide lists the standards explicitly: the solution must reduce average lunch period length to at least 25 minutes, must not require additional staff, and must be implementable before the next academic year. A constraints slide names the boundaries: budget of $0 (schedule restructuring only), existing staff contracts, and state-mandated instructional minutes per day. Students who establish criteria and constraints before evaluating options have a framework for defending their recommendation. Students who skip this zone cannot explain why they chose one option over another except by asserting that it seemed better.
Options Analysis: Showing the Work
The options analysis zone is the heart of the problem-solving presentation and the zone most student presentations reduce to a single slide with three options briefly described. Effective options analysis requires that each option be evaluated against the established criteria and constraints. A comparison matrix — options across the top, criteria down the side, ratings or assessments in the cells — is the most efficient visual format for this work because it makes the evaluation transparent.
Students often resist the comparison matrix because they are concerned it will expose weaknesses in their preferred option. That concern is backwards. A comparison matrix that shows the recommended option outperforming alternatives on the most important criteria is more persuasive than a summary that asserts the same conclusion. The transparency builds credibility rather than undermining it.
Bullet Formatting in Problem-Solving Presentations
Bullets in a problem-solving presentation are analytical, not procedural or argumentative. They summarize findings, identify tradeoffs, and name specific criteria met or not met. Vague analytical bullets (“Option B has some advantages over Option A”) communicate nothing. Specific analytical bullets (“Option B meets four of five criteria but exceeds the budget constraint by 15%”) communicate a finding.
The parallel structure requirement is especially important in options analysis slides, where each option must be described using the same evaluative framework. If Option A’s bullet leads with cost, Option B’s bullet must also lead with cost. Parallel structure in analysis slides is not just a formatting preference — it is a signal that the evaluation was consistent.
The Visual Layer: Making the Analysis Visible
Problem-solving presentations depend on visuals that make the analysis visible, not visuals that decorate the topic. The problem definition zone benefits from charts or diagrams that show the gap between current and desired state. The criteria zone benefits from a clear table or list that the audience can reference throughout the presentation. The options analysis zone benefits from a comparison matrix. The recommendation zone benefits from a visual that shows the recommended option in its implemented state.
Edward Tufte’s core principle in The Visual Display of Quantitative Information is that effective data graphics show the data, not the design. In problem-solving presentations, the equivalent principle is that effective visuals show the analysis, not the topic. A photograph of a crowded school hallway illustrates the problem. A chart showing how each schedule option affects average lunch period length by student cohort does the analytical work the photograph cannot.
The Recommendation and Next Steps
The recommendation slide states the recommended option, names the criteria it best satisfies, and acknowledges the tradeoffs it involves. A recommendation that does not acknowledge its own tradeoffs is a sales pitch, not an analysis. The next steps slide identifies what must happen for the recommendation to be implemented: who decides, by when, and what the first action is.
Practical Starting Points for Teachers
- Require a written problem definition before the deck is built. Students who cannot write a precise problem definition in two to three sentences are not ready to propose a solution. Collect and review the problem definition before slide work begins.
- Require criteria and constraints to be established before options are evaluated. This is the most structurally important rule in problem-solving presentations. Students who evaluate options before establishing criteria cannot defend their recommendation against a challenge.
- Require a comparison matrix in the options analysis zone. A comparison matrix that evaluates each option against the stated criteria is the minimum standard for rigorous options analysis. Students who resist it are protecting a predetermined conclusion rather than analyzing a problem.
- Teach the distinction between problem-solving and persuasive presentations explicitly. Students conflate the two. The difference is that a problem-solving presentation shows how a recommendation was reached, not just why it should be adopted. The thinking is the product.
- Require the recommendation slide to acknowledge tradeoffs. A recommendation without tradeoffs is an assertion. Requiring students to name what their recommended option does not do well is the most efficient way to assess whether they actually evaluated the options or just chose a preferred conclusion.
The Through Line
The problem-solving presentation fails when students treat it as a persuasive presentation with extra steps. The job is not to convince the audience that the answer is correct. The job is to show the audience that the analysis was rigorous enough to trust. A recommendation that emerges from a transparent, criteria-driven process is credible in a way that a recommendation delivered without that process cannot be, regardless of how well it is argued.
Teaching students to build problem-solving presentations with a defined problem, explicit criteria, evaluated options, and a recommendation with acknowledged tradeoffs produces students who can analyze complex situations rather than just assert positions. That is a transferable skill well beyond any single assignment.
Tufte, E.R., The Visual Display of Quantitative Information, 2nd ed. (Graphics Press, 2001); Duarte, N., Slide:ology (O'Reilly Media, 2008); Minto, B., The Pyramid Principle (Pearson, 1987).