A student assigned to present data on climate change opens with seven slides of dense text and no visuals. Her classmates check their phones. She has done the research. She has not built a presentation—she has built a report and read it aloud.
The informative presentation is one of the most common assignments in secondary school and one of the most commonly misunderstood. Students treat it as a data-delivery task: gather information, put it on slides, present. Effective informative presentations are not data dumps. They are structured communication that moves an audience from not knowing to knowing, with each slide doing a specific job. Building that kind of presentation is a teachable skill.
What an Informative Presentation Is Designed to Do
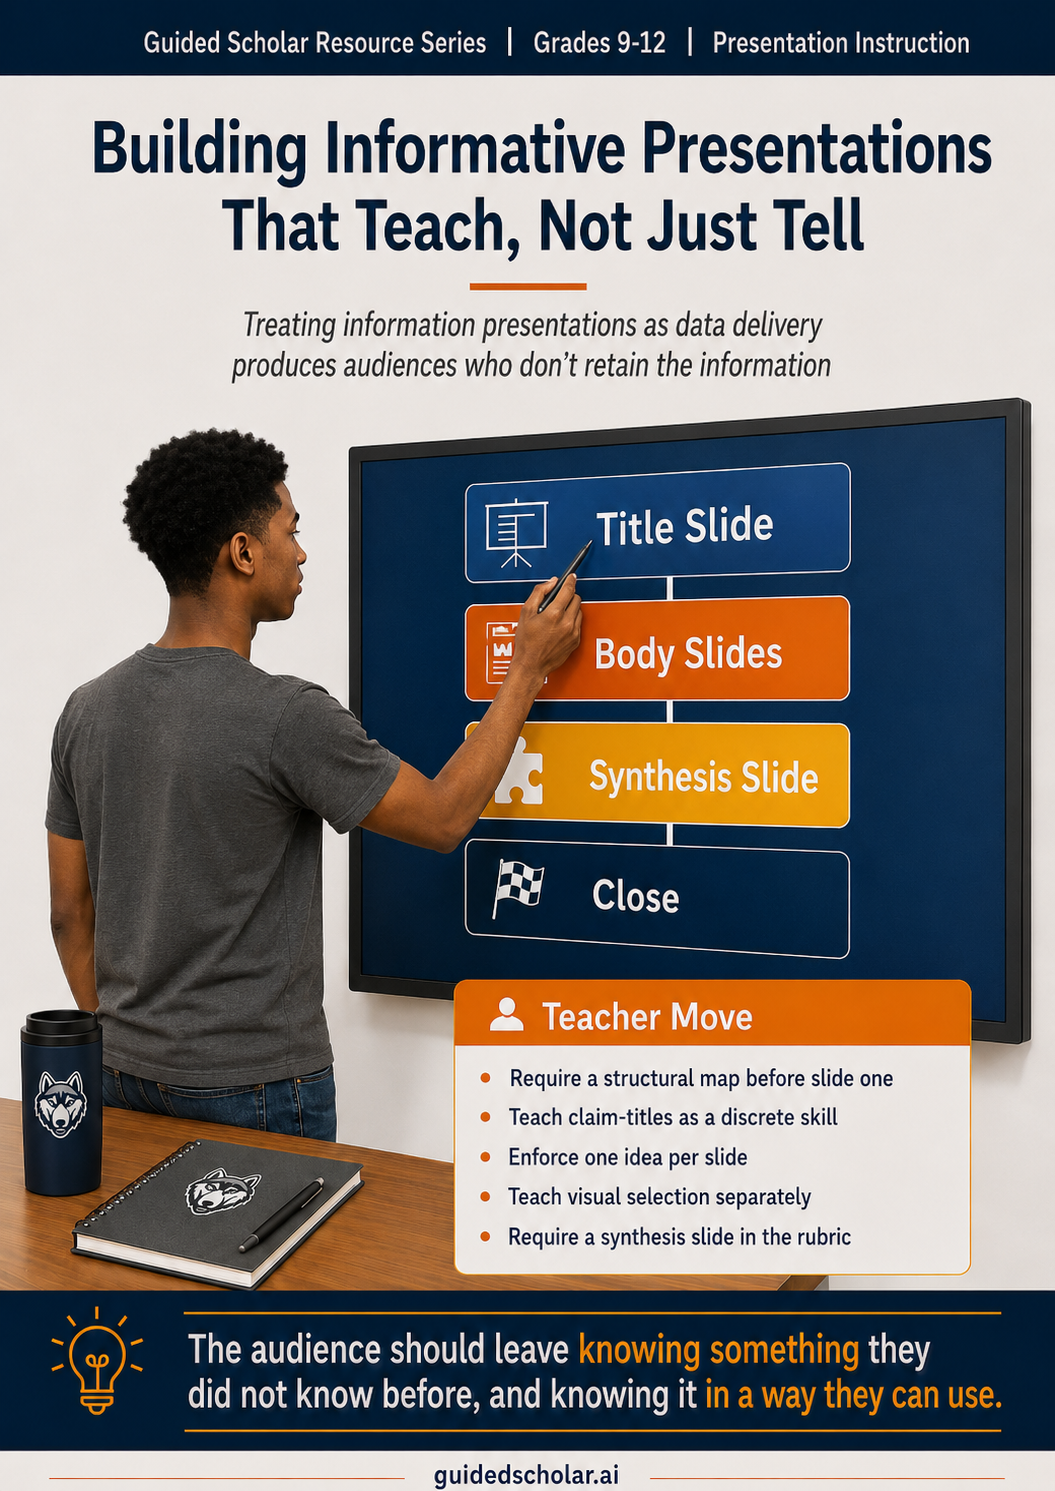
The informative presentation has a single job: transfer understanding. Not opinions, not persuasion—understanding. The audience should leave knowing something they did not know before, and knowing it in a way they can use.
Richard Mayer’s research on multimedia learning established that audiences process verbal and visual information through separate channels, and that overloading either channel reduces retention. A slide packed with text while the presenter speaks the same text creates redundancy that degrades comprehension. The audience cannot listen and read simultaneously without losing both. The practical implication is structural: slides are not a script. Each slide should carry what words alone cannot—data visualizations, diagrams, key terms—while the presenter carries the explanation, context, and connection.
The Architecture of an Informative Slide Deck
Before building slide by slide, students need a structural map. An informative presentation has four functional zones: the opening, the body, the synthesis, and the close. The opening establishes the topic and what the presentation will cover. One to two slides. The body delivers information in discrete sections, organized by subtopic or sequence. The synthesis connects the pieces—what the data means together, not just individually. The close reinforces the key takeaway without repeating everything the audience just heard.
Students who jump directly to building slides without mapping this structure produce presentations that wander. The map comes first. The slides follow the map.
Building the Title Slide
The title slide does three things: identifies the topic, signals the scope, and sets the visual register of the deck. A weak title slide—topic name in large font, nothing else—gives the audience no reason to engage before the presenter speaks. A strong title slide names the topic specifically (not “Climate Change” but “Rising Ocean Temperatures: What the Data Shows and What It Means”), includes a framing line that signals scope, and anchors a relevant visual. That visual is not decorative. It begins the audience’s mental engagement with the topic before the first word is spoken.
Building the Body Slides: One Idea Per Slide
The most common structural failure in student informative presentations is the everything-slide: one slide covering three subtopics with eight bullet points and two charts. Audiences cannot process it. The rule is one idea per slide: one claim, one piece of supporting data, one visual.
Each body slide title should state a claim, not a category label. “Economic Inequality” is a label. “The wage gap between the top and bottom income quintiles doubled between 1980 and 2020” is a claim. A title that makes a claim tells the audience the takeaway before they process the supporting content. The body then develops that claim through two to four bullets providing evidence, context, or explanation. Garr Reynolds identifies the failure mode students fall into in Presentation Zen: slides that try to function as both visual aid and written document simultaneously succeed at neither.
Bullet Formatting: What Students Get Wrong
Bullets in an informative presentation are not a place to put everything the student knows. They are a place to put what the audience needs to see while the presenter explains it. Effective bullets are parallel in structure, specific in content, and short enough to read at a glance. Any bullet that takes more than ten seconds to read is competing with the presenter rather than supporting her.
Fragments versus full sentences is a judgment call. The test is whether the audience can understand the bullet without the presenter’s explanation. What students should never do is paste sentences from their notes directly onto slides. That shifts audience attention from listening to reading, violating the dual-channel principle Mayer’s research identified.
The Visual Layer: Charts, Diagrams, and Images
The visual layer is not optional. It is where understanding is built. Data comparison calls for bar charts (discrete categories) or line charts (change over time). Process and sequence call for flowcharts or cycle diagrams. Context and scale call for photographs, maps, or infographics. Nancy Duarte’s analysis in Slide:ology describes the visual as the component that makes the abstract tangible. The test for every slide is simple: does this visual help the audience understand the claim? If yes, it belongs. If it is decorative, it does not.
Chart titles follow the same rule as slide titles. “Sales by Region” is a label. “Northeast Region Led Sales Growth in Q3” is a finding. Students who write finding-based chart titles produce charts that do interpretive work for the audience rather than leaving the interpretation to chance.
The Synthesis Slide
The synthesis slide is the slide most student presentations omit. Body slides deliver individual pieces of information. The synthesis slide connects them and answers the question the audience has been building throughout: what does all of this mean together? For a data-heavy presentation, this might be a summary chart placing all data in one comparative view. For a process presentation, it might be the completed diagram with all stages visible. Students often skip it because they assume the audience has been keeping track. Audiences do not keep track.
What This Looks Like in Guided Scholar
Guided Scholar’s Teach Me mode builds the informative presentation slide by slide. For each slide, the student identifies the title, decides on body content (bullets or prose), and receives a suggested visual type—chart, diagram, image, or infographic—before making her own final visual decision. The student can submit for feedback at any point during the build, not only when the deck is complete.
The teacher’s dashboard shows the slide-by-slide build as it develops, including each feedback cycle and subsequent revisions. A student who revises a label-title to a claim-title after feedback has demonstrated a specific skill improvement that a completed deck alone cannot show. The revision history is visible alongside the final product.
Practical Starting Points for Teachers
- Require a structural map before the first slide is built. Students who plan the four zones before building slides produce more coherent decks. A one-page outline showing the opening, body subtopics, synthesis, and close takes ten minutes and prevents the most common structural failures.
- Teach slide titles as claims, not labels. Give students five label-titles and ask them to rewrite each as a claim. This is a discrete, teachable skill, and the distinction between a label and a claim is one of the highest-leverage moves in presentation instruction.
- Enforce the one-idea-per-slide rule explicitly. One claim, one to four supporting bullets, one visual. Any slide that violates this rule gets revised before delivery.
- Teach the visual decision separately. Students identify the right visual type for a described content scenario before building the slide. Matching content type to visual type is a transferable skill that improves every future presentation.
- Require a synthesis slide in the rubric. A presentation without a synthesis slide is incomplete, not stylistically different. Students build what is assessed.
The Through Line
The informative presentation fails most often not because students lack information but because they have never been taught what a slide is supposed to do. A slide is not a page of notes projected on a wall. It is a visual complement to a spoken argument, designed to make the abstract concrete and the complex manageable. Each slide has a job, and that job should be visible in its title, legible in its bullets, and reinforced by its visual.
Teaching students to build informative presentations slide by slide—with a structural map, claim-based titles, purposeful bullets, and matched visuals—produces a different result than assigning a slide count and a due date. The skill is not innate. It is built through instruction, feedback, and revision against specific criteria.
Mayer, R.E., Multimedia Learning, 2nd ed. (Cambridge University Press, 2009); Reynolds, G., Presentation Zen (New Riders, 2008); Duarte, N., Slide:ology (O'Reilly Media, 2008).